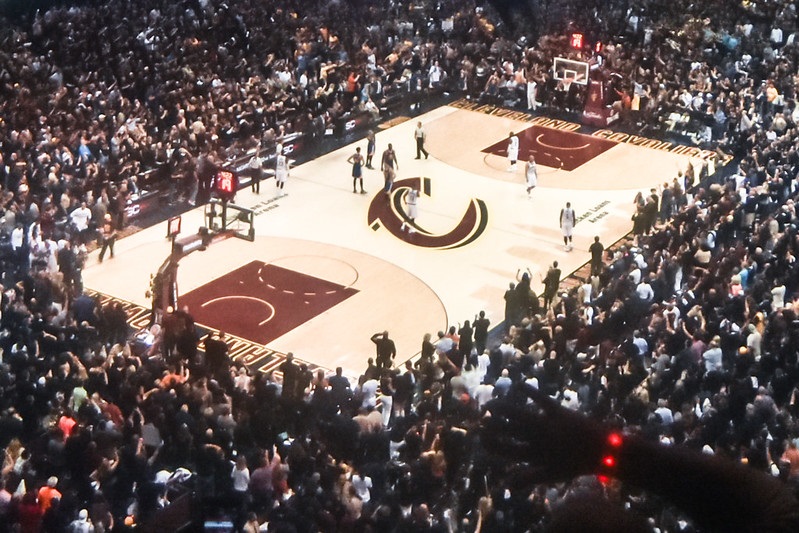
Image Credit: Erik Drost (CC BY 2.0)
The 2012-2013 NBA season was much like the 2011-2012 season in result. The Miami Heat repeated as NBA champions by defeating the San Antonio Spurs in game 7 of the NBA Finals. Lebron James was once again, crowned the league's MVP and was the Eastern Conference player of the month in all but one month.
Here is how all 30 NBA teams fared in attendance during the 2012-2013 season.
|
Venue/Team |
Total Season Attendance |
Avg. Nightly Attendance |
Percentage of Capacity |
|
1. United Center (Bulls) |
896944 |
21876 |
104.60% |
|
2. American Airlines Center (Mavericks) |
821490 |
20036 |
104.40% |
|
3. American Airlines Arena (Heat) |
819290 |
19982 |
102.00% |
|
4. Moda Center (Trail Blazers) |
813012 |
19829 |
95.40% |
|
5. Oracle Arena (Warriors) |
794320 |
19373 |
98.90% |
|
6. Staples Center (Clippers) |
788293 |
19226 |
100.90% |
|
7. Madison Square Garden (Knicks) |
780353 |
19033 |
96.30% |
|
8. Staples Center (Lakers) |
778877 |
18997 |
99.70% |
|
9. EnergySolutions Arena (Jazz) |
765915 |
18680 |
93.80% |
|
10. TD Garden (Celtics) |
744960 |
18624 |
100.00% |
|
11. AT&T Center (Spurs) |
755700 |
18431 |
99.20% |
|
12. Chesapeake Energy Arena (Thunder) |
746323 |
18203 |
100.00% |
|
13. Air Canada Centre (Raptors) |
743936 |
18144 |
91.60% |
|
14. Pepsi Center (Nuggets) |
730616 |
17819 |
93.00% |
|
15. Amway Center (Magic) |
721414 |
17595 |
93.40% |
|
16. Barclays Center (Nets) |
704702 |
17187 |
94.90% |
|
17. Wells Fargo Center (76ers) |
685412 |
16717 |
82.20% |
|
18. Toyota Center (Rockets) |
683564 |
16672 |
92.40% |
|
19. Fedex Forum (Grizzlies) |
681613 |
16624 |
91.80% |
|
20. Verizon Center (Wizards) |
670070 |
16343 |
80.60% |
|
21. Target Center (Timberwolves) |
669956 |
16340 |
84.40% |
|
22. Quicken Loans Arena (Cavaliers) |
663882 |
16192 |
78.70% |
|
23. US Airways Center (Suns) |
632913 |
15436 |
83.80% |
|
24. Time Warner Cable Arena (Hornets) |
628293 |
15324 |
80.30% |
|
25. BankersLife Fieldhouse (Pacers) |
626069 |
15269 |
84.10% |
|
26. Philips Arena (Hawks) |
620146 |
15125 |
80.80% |
|
27. BMO Harris Bradley Center (Bucks) |
616469 |
15035 |
80.30% |
|
28. Palace of Auburn Hills (Pistons) |
606094 |
14782 |
67.00% |
|
29. Smoothie King Center (Pelicans) |
565930 |
13803 |
80.30% |
|
30. Sleep Train Arena (Kings) |
563743 |
13749 |
79.40% |
For the 4th straight season, the Chicago Bulls led the NBA in overall attendance. Four arenas averaged more than 100% of their capacities including the United Center, Staples Center, American Airlines Center and American Airlines Arena. The Sacramento Kings' home arena changed names from the Power Balance Pavilion to Sleep Train Arena. This would be the final year that New Orleans' franchise would be known as the Hornets and would go on to change their name to the Pelicans. The Brooklyn Nets went from dead last in attendance during the 2011-2012 campaign to 16th in attendance during the 2012-2013 season. The reason? They changed venues and moved from the Prudential Center in Newark to the brand new Barclays Center in Brooklyn, the NBA's newest arena. Watch the same happen when the NHL's Islanders move from Long Island to the Barclays Center for the 2015 season.
Once again, the Milwaukee Bucks, Detroit Pistons and Sacramento Kings finished in the bottom 5 in overall attendance. With a core nucleus of James Harden, Dwight Howard and Chandler Parsons, the Houston Rockets and the Toyota Center drew 180,000 more fans than the previous season.
Related Articles
- 2013-2014 NBA Attendance Recap
- 2011-2012 NBA Attendance Recap
- Fan Cost Index for the 2014-2015 NBA Season
- Fan Cost Index for the 2013-2014 NBA Season
- The Top Ten Largest NBA Arenas
- 2014-2015 NBA Team Salaries and Payroll

