
Image Credit: Fuzzy Gerdes (CC BY 2.0)
The 2011-2012 NBA Season began on Christmas Day with 5 games as the result of a lockout shortened season. The Miami Heat defeated the Oklahoma City Thunder in game 5 of the NBA Finals and Lebron James was voted the league's MVP and the Finals MVP. Here is how each team's attendance numbers turned out for the 2011-2012 NBA season.
|
Venue/Team |
Total Season Attendance |
Avg. Nightly Attendance |
Percentage of Venue's Capacity |
|
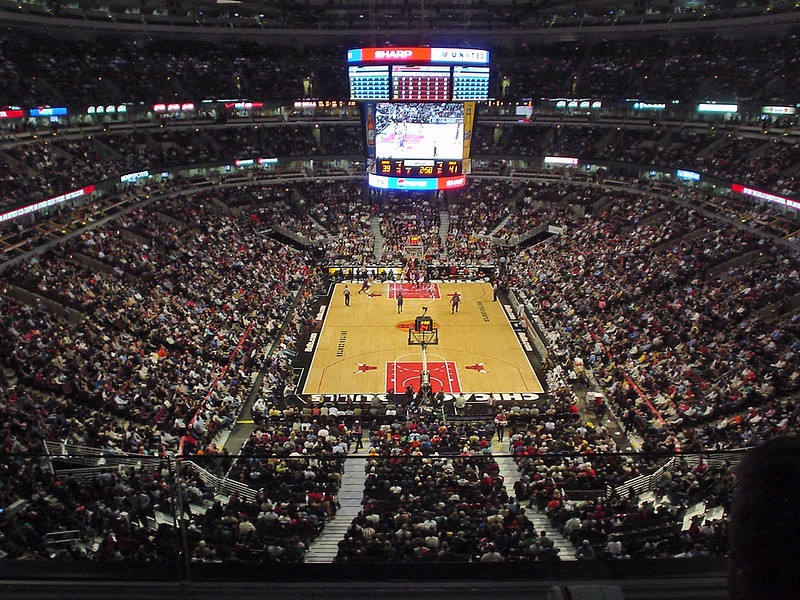
1. United Center (Bulls) |
731326 |
22161 |
105.90% |
|
2. Moda Center (Trail Blazers) |
676384 |
20496 |
102.60% |
|
3. American Airlines Center (Mavericks) |
671050 |
20334 |
105.90% |
|
4. American Airlines Arena (Heat) |
657855 |
19935 |
101.70% |
|
5. Madison Square Garden (Knicks) |
652179 |
19763 |
100.00% |
|
6. EnergySolutions Arena (Jazz) |
637124 |
19306 |
97.00% |
|
7. Staples Center (Clippers) |
634237 |
19219 |
100.80% |
|
8. Staples Center (Lakers) |
626901 |
18997 |
99.70% |
|
9. Amway Center (Magic) |
623587 |
18896 |
102.10% |
|
10. Oracle Arena (Warriors) |
622311 |
18857 |
96.20% |
|
11. TD Garden (Celtics) |
614592 |
18624 |
100.00% |
|
12. AT&T Center (Spurs) |
607095 |
18396 |
99.00% |
|
13. Chesapeake Energy Arena (Thunder) |
600699 |
18203 |
100.00% |
|
14. Wells Fargo Center (76ers) |
577597 |
17502 |
86.10% |
|
15. Target Center (Timberwolves) |
577197 |
17490 |
90.40% |
|
16. Pepsi Center (Nuggets) |
561966 |
17029 |
88.90% |
|
17. Air Canada Centre (Raptors) |
555584 |
16835 |
85.00% |
|
18. Verizon Center (Wizards) |
552038 |
16728 |
82.90% |
|
19. Quicken Loans Arena (Cavaliers) |
525577 |
15926 |
77.50% |
|
20. Fedex Forum (Grizzlies) |
518256 |
15704 |
86.70% |
|
21. US Airways Center (Suns) |
514718 |
15597 |
84.70% |
|
22. Toyota Center (Rockets) |
506994 |
15363 |
85.10% |
|
23. Philips Arena (Hawks) |
501593 |
15199 |
81.20% |
|
24. Smoothie King Center (Pelicans) |
498618 |
15109 |
88.40% |
|
25. Time Warner Cable Arena (Hornets) |
486984 |
14757 |
77.40% |
|
26. BMO Harris Bradley Center (Bucks) |
485717 |
14718 |
78.60% |
|
27. Sleep Train Arena (Kings) |
478764 |
14508 |
83.80% |
|
28. Palace of Auburn Hills (Pistons) |
475638 |
14413 |
65.30% |
|
29. BankersLife Fieldhouse (Pacers) |
467561 |
14168 |
78.00% |
|
30. Prudential Center (Nets) |
460719 |
13961 |
75.50% |
Based on the recent attendances of previous NBA seasons, the Chicago Bulls, Dallas Mavericks, Miami Heat, New York Knicks and Portland Trail Blazers are consistently the most frequented NBA arenas. Six teams boasted attendances of more than their arena's capacity. Attendances above capacity can be reached by team's offering 'Standing Room Only' Tickets on a nightly basis. Teams commonly at the bottom of NBA attendance lists in recent years include the Sacramento Kings, Detroit Pistons, Milwaukee Bucks, Atlanta Hawks and New Orleans Pelicans. No new NBA arenas debuted during the 2011-2012 NBA season but this would be the final year that the New Jersey Nets would play at the Prudential Center in Newark, NJ. Afterward, they moved to Brooklyn, NY to play in the Barclays Center.
Interestingly enough, the often less popular Los Angeles Clippers outperformed their co-tenants, the Los Angeles Lakers in all three attendance categories during the 2011-2012 season. This could be attributed likely to the recent pairing of Blake Griffin with guard Chris Paul.
Related Articles
- 2013-2014 NBA Attendance Recap
- 2012-2013 NBA Attendance Recap
- The Top Ten Largest NBA Arenas
- Fan Cost Index for the 2014-2015 NBA Season
- Top 10 Greatest NBA Players of All Time
- The Ten Worst NBA Players of All Time