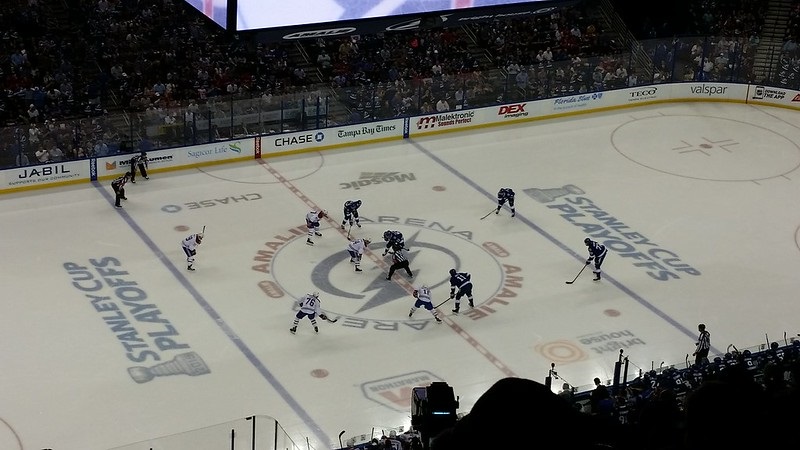
Image Credit: Artic Whirlwind - Flickr (CC BY-ND 2.0)
See how much money your favorite NHL team spent on payroll during the 2013-2014 NHL Season.
|
Team |
Total Team Payroll |
Available Cap Space |
|
$67,072,431.00 |
-$2,772,431.00 |
|
|
$66,793,890.00 |
-$2,493,890.00 |
|
|
$65,966,280.00 |
-$1,666,280.00 |
|
|
$65,811,811.00 |
-$1,511,811.00 |
|
|
$65,760,880.00 |
-$1,460,880.00 |
|
|
$64,926,986.00 |
-$626,986.00 |
|
|
$64,391,804.00 |
-$91,804.00 |
|
|
$64,240,595.00 |
$59,405.00 |
|
|
$64,166,258.00 |
$133,742.00 |
|
|
10. St. Louis Blues |
$64,112,883.00 |
$187,117.00 |
|
$63,840,934.00 |
$459,066.00 |
|
|
12. Boston Bruins |
$63,763,221.00 |
$536,779.00 |
|
13. Winnipeg Jets |
$63,682,588.00 |
$617,412.00 |
|
$63,639,715.00 |
$660,285.00 |
|
|
$63,594,029.00 |
$705,971.00 |
|
|
$63,578,616.00 |
$721,384.00 |
|
|
17. New York Rangers |
$63,369,820.00 |
$930,180.00 |
|
18. Phoenix Coyotes |
$62,330,584.00 |
$1,969,416.00 |
|
19. Minnesota Wild |
$61,985,346.00 |
$2,314,654.00 |
|
20. Dallas Stars |
$61,608,544.00 |
$2,691,456.00 |
|
$61,520,184.00 |
$2,779,816.00 |
|
|
22. Anaheim Ducks |
$60,250,517.00 |
$4,049,483.00 |
|
$59,443,457.00 |
$4,856,543.00 |
|
|
24. Buffalo Sabres |
$57,330,961.00 |
$6,969,039.00 |
|
25. Edmonton Oilers |
$57,269,641.00 |
$7,030,359.00 |
|
26. Ottawa Senators |
$56,498,998.00 |
$7,801,022.00 |
|
$52,940,153.00 |
$11,359,847.00 |
|
|
28. Calgary Flames |
$52,218,491.00 |
$12,081,509.00 |
|
$51,716,432.00 |
$12,583,568.00 |
|
|
30. Florida Panthers |
$50,631,901.00 |
$13,668,099.00 |
Related Articles
- 2014-2015 NHL Team Salaries and Payroll
- 2013-2014 NHL Attendance Recap
- 2012-2013 NHL Attendance Recap
- 2011-2012 NHL Attendance Recap
- NHL Arenas - Construction Cost Rankings

