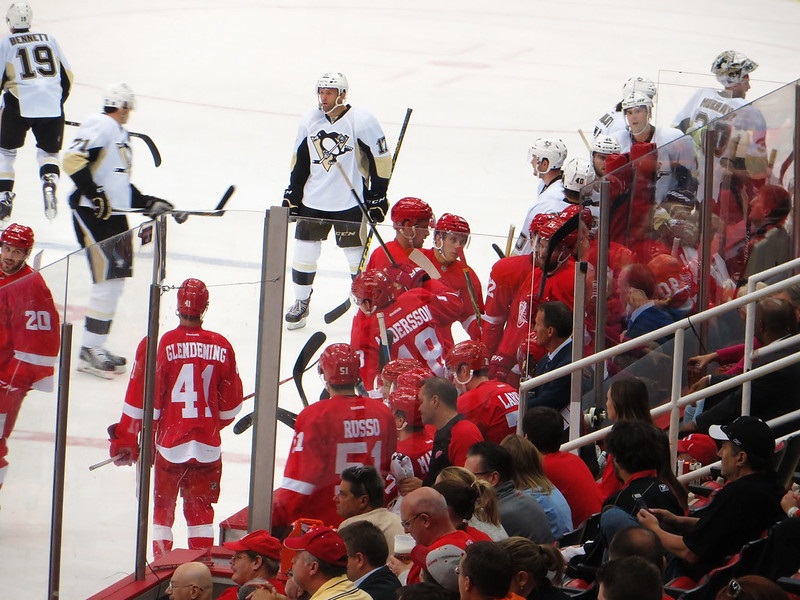
Image Credit: Ken Lund (CC BY-SA 2.0)
The 2012-2013 NHL season was a short one due to the lockout over the collective bargaining agreement. Instead of beginning in October, the regular season didn't begin until January and ended in April. Nevertheless, the season turned out in typical fashion with Alexander Ovechkin winning the league's MVP and two Original Six teams in the Stanley Cup Finals. The Chicago Blackhawks went on to beat the Boston Bruins to win the Stanley Cup.
Here is what the NHL attendance numbers for all 30 arenas looked like for the 2012-2013 season.
|
Venue/Team |
Total Season Attendance |
Avg. Nightly Attendance |
Percentage of Capacity |
|
1. United Center (Blackhawks) |
522619 |
21775 |
110.40% |
|
2. Bell Centre (Canadiens) |
510552 |
21273 |
100.00% |
|
3. Joe Louis Arena (Red Wings) |
481584 |
20066 |
100.00% |
|
4. Wells Fargo Center (Flyers) |
474878 |
19786 |
101.30% |
|
5. Air Canada Centre (Maple Leafs) |
466229 |
19426 |
103.20% |
|
6. Canadian Tire Centre (Senators) |
465801 |
19408 |
101.30% |
|
7. Scotiabank Saddledome (Flames) |
462936 |
19289 |
100.00% |
|
8. Amalie Arena (Lightning) |
457337 |
19055 |
99.20% |
|
9. First Niagara Center (Sabres) |
455290 |
18970 |
99.50% |
|
10. Rogers Arena (Canucks) |
454740 |
18947 |
100.20% |
|
11. Xcel Energy Center (Wild) |
451075 |
18794 |
104.70% |
|
12. Consol Energy Center (Penguins) |
447560 |
18648 |
101.40% |
|
13. Staples Center (Kings) |
436295 |
18178 |
100.30% |
|
14. Verizon Center (Capitals) |
425638 |
17734 |
95.80% |
|
15. TD Garden (Bruins) |
421560 |
17565 |
100.00% |
|
16. SAP Center at San Jose (Sharks) |
421472 |
17561 |
100.00% |
|
17. PNC Arena (Hurricanes) |
421401 |
17558 |
94.00% |
|
18. Scottrade Center (Blues) |
414328 |
17263 |
90.10% |
|
19. Madison Square Garden (Rangers) |
412800 |
17200 |
100.00% |
|
20. Prudential Center (Devils) |
410739 |
17114 |
97.10% |
|
21. American Airlines Center (Stars) |
409521 |
17063 |
92.10% |
|
22. BB&T Center (Panthers) |
421401 |
17558 |
94.00% |
|
23. Bridgestone Arena (Predators) |
407386 |
16974 |
99.20% |
|
24. Rexall Place (Oilers) |
404136 |
16839 |
100.00% |
|
25. Honda Center (Ducks) |
381308 |
15887 |
92.50% |
|
26. Pepsi Center (Avalanche) |
370677 |
15444 |
85.80% |
|
27. MTS Centre (Jets) |
360096 |
15004 |
100.00% |
|
28. Nationwide Arena (Blue Jackets) |
349558 |
14564 |
80.30% |
|
29. Jobing.com Arena (Coyotes) |
334165 |
13923 |
81.30% |
|
30. Nassau Coliseum (Islanders) |
319362 |
13306 |
82.30% |
For the 4th straight season, both the New York Islanders and the Phoenix Coyotes finished in the bottom two positions in overall attendance. An astonishing 16 of the 30 NHL franchises sold out every single home game. For the 5th straight season, the Chicago Blackhawks led the NHL in overall attendance. 5 of Canada's 7 NHL franchises finished in the top 10 in attendance. The Minnesota Wild saw perhaps the largest increase in attendance finishing 9th after being 16th attendance just one season before. The New York Rangers saw a large decrease in attendance by finishing 19th after being number 14 on the attendance list during the 2011-2012 season. The top five franchises in overall attendance (Blackhawks, Canadiens, Flyers, Red Wings, Maple Leafs) remained almost unchanged from the previous two seasons.
Related Articles
- 2013-2014 NHL Attendance Recap
- 2011-2012 NHL Attendance Recap
- The NHL Franchise Scenario in Las Vegas, Quebec City and Seattle.
- 2014-2015 NHL Team Salaries and Payroll
- 2013-2014 NHL Team Salaries and Payroll
- Planning Your Trip to the Hockey Hall of Fame in Toronto, Ontario.

