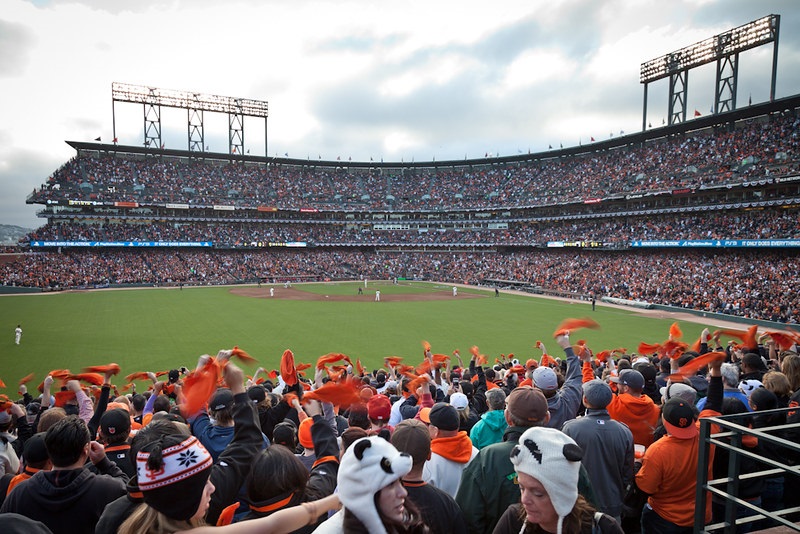
Image Credit: Randy Chiu (CC BY 2.0)
The 2013 was an unpredictable year. Fueled by the Boston Marathon bombings, the Boston Red Sox went on to defeat the St. Louis Cardinals in the World Series. The Houston Astros switched over to the American League to join the West division, giving each league an even 15 teams. This led to more Inter-League play which excites many baseball fans.
Here is how the attendance for each Major League Baseball team shaped up during the 2013 season.
|
Venue/Team |
Total Season Attendance |
Avg. Nightly Attendance |
Percentage of Capacity |
|
1. Dodger Stadium (Dodgers) |
3743527 |
46216 |
82.50% |
|
2. Busch Stadium (Cardinals) |
3369769 |
41602 |
94.60% |
|
3. AT&T Stadium (Giants) |
3326796 |
41584 |
99.20% |
|
4. Yankee Stadium (Yankees) |
3279589 |
40488 |
80.50% |
|
5. Globe Life Park (Rangers) |
3178273 |
38759 |
78.80% |
|
6. Comerica Park (Tigers) |
3083397 |
38066 |
92.30% |
|
7. Angel Stadium of Anaheim (Angels) |
3019505 |
37277 |
82.10% |
|
8. Citizens Bank Park (Phillies) |
3012403 |
37190 |
85.20% |
|
9. Fenway Park (Red Sox) |
2833333 |
34979 |
94.40% |
|
10. Coors Field (Rockies) |
2793828 |
34491 |
68.30% |
|
11. Nationals Park (Nationals) |
2652422 |
32745 |
78.90% |
|
12. Wrigley Field (Cubs) |
2642682 |
32625 |
79.30% |
|
13. Turner Field (Braves) |
2548679 |
31465 |
63.30% |
|
14. Rogers Centre (Blue Jays) |
2536562 |
31315 |
63.60% |
|
15. Great American Ballpark (Reds) |
2534369 |
31288 |
73.90% |
|
16. Miller Park (Brewers) |
2531105 |
31248 |
74.60% |
|
17. Target Field (Twins) |
2477644 |
30588 |
77.40% |
|
18. Oriole Park at Camden Yards (Orioles) |
2357561 |
29105 |
64.10% |
|
19. PNC Park (Pirates) |
2256862 |
28210 |
73.50% |
|
20. Petco Park (Padres) |
2166691 |
26749 |
62.70% |
|
21. Citi Field (Mets) |
2135657 |
26695 |
63.90% |
|
22. Chase Field (Diamondbacks) |
2134795 |
26355 |
54.20% |
|
23. O.co Coliseum (Athletics) |
1809302 |
22337 |
63.70% |
|
24. U.S. Cellular Field (White Sox) |
1768413 |
22105 |
54.40% |
|
25. Safeco Field (Mariners) |
1761546 |
21747 |
45.40% |
|
26. Kauffman Stadium (Royals) |
1750754 |
21614 |
57.00% |
|
27. Minute Maid Park (Astros) |
1651883 |
20393 |
49.80% |
|
28. Progressive Field (Indians) |
1572926 |
19661 |
45.30% |
|
29. Marlins Park (Marlins) |
1586322 |
19584 |
52.30% |
|
30. Tropicana Field (Rays) |
1510300 |
18645 |
54.70% |
The Los Angeles Dodgers made an incredible jump in attendance from 3.3 million fans during the 2012 season to 3.7 million fans in 2013. The acquisition of the exciting Yasiel Puig had a lot to do with the increase. Changing ownership groups from Frank Mccourt to Guggenheim Partners was also a vital aspect. The Dodgers went on to finish as the National League's runners up. For the 2nd straight season, the Astros, Indians and Rays finished in the bottom five in league attendance. Until the Rays build a ballpark in Tampa instead of playing in St. Petersburg, they will continue to draw poor attendances. Plus, being able to play outdoors in the beautiful Tampa weather would only add to the appeal of attending Rays games.
One of the largest declines in attendance was at Citizens Bank Park in Philadelphia. In 2012, they operated at an attendance capacity of 100% (every game was sold out). In 2013, they operated at an attendance capacity of 85%. They fell from first in attendance to eighth. In it's 2nd season of operation, Marlins Park in Miami also turned out to be a huge disappointment. Failing to draw the large crowds that they had hoped for in Little Havana, the Marlins finished with just 1.5 million in total attendance for the 2013 season. This after hosting a respectable 2.2 million fans in 2012.
Related Articles
- 2012 Major League Baseball Attendance Recap
- 2011 Major League Baseball Attendance Recap
- MLB Ballparks - Construction Cost Rankings
- Top 10 Largest MLB Stadiums
- Who's Who Among Major League Baseball's "Super Fans"

