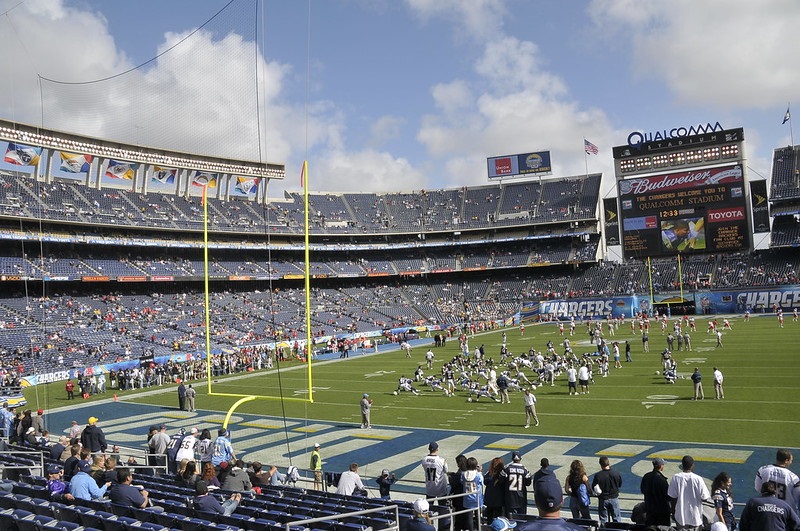
Image Credit: SD Dirk (CC BY 2.0)
The outcome of the 2012 NFL season was anything but dull. The San Francisco 49ers and Baltimore Ravens both returned to their former dominance by earning a trip to the Super Bowl in New Orleans. For the first time ever, two brothers would coach against each other in a Super Bowl (Jim and John Harbaugh). The Baltimore Ravens went on to win their second Super Bowl since 1999.
Here is how each team fared in attendance for the 2012 NFL season.
|
Venue/Team |
Total Season Attendance |
Avg. Nightly Attendance |
Percentage of Capacity |
|
1. AT&T Stadium (Cowboys) |
708249 |
88531 |
110.70% |
|
2. Metlife Stadium (Giants) |
643964 |
80495 |
97.60% |
|
3. Fedex Field (Redskins) |
637236 |
79654 |
86.90% |
|
4. Metlife Stadium (Jets) |
632704 |
79088 |
95.90% |
|
5. Sports Authority Field at Mile High (Broncos) |
613062 |
76632 |
100.70% |
|
6. Bank of America Stadium (Panthers) |
586347 |
73293 |
99.30% |
|
7. Mercedes-Benz Superdome (Saints) |
583107 |
72888 |
99.90% |
|
8. NRG Stadium (Texans) |
573321 |
71665 |
100.90% |
|
9. M&T Bank Stadium (Ravens) |
570229 |
71278 |
100.40% |
|
10. Lambeau Field (Packers) |
564062 |
70507 |
96.70% |
|
11. Georgia Dome (Falcons) |
560773 |
70096 |
98.40% |
|
12. Candlestick Park (49ers) |
557856 |
69732 |
99.30% |
|
13. Lincoln Financial Field (Eagles) |
553152 |
69144 |
102.30% |
|
14. LP Field (Titans) |
553144 |
69143 |
100.00% |
|
15. Gillette Stadium (Patriots) |
550044 |
68755 |
100.00% |
|
16. Arrowhead Stadium (Chiefs) |
548070 |
68508 |
89.30% |
|
17. CenturyLink Field (Seahawks) |
543570 |
67946 |
101.40% |
|
18. FirstEnergy Stadium (Browns) |
533058 |
66632 |
91.00% |
|
19. Lucas Oil Stadium (Colts) |
521518 |
65189 |
103.50% |
|
20. Everbank Field (Jaguars) |
519872 |
64984 |
96.80% |
|
21. Ralph Wilson Stadium (Bills) |
454653 |
64950 |
88.90% |
|
22. Ford Field (Lions) |
510158 |
63769 |
98.90% |
|
23. Soldier Field (Bears) |
498633 |
62329 |
101.30% |
|
24. Paul Brown Stadium (Bengals) |
489504 |
61188 |
93.40% |
|
25. Heinz Field (Steelers) |
489135 |
61141 |
94.10% |
|
26. University of Phoenix Stadium (Cardinals) |
487125 |
60890 |
96.00% |
|
27. The Metrodome (Vikings) |
485802 |
60725 |
94.70% |
|
28. Qualcomm Stadium (Chargers) |
479716 |
59964 |
84.10% |
|
29. Sun Life Stadium (Dolphins) |
459033 |
57379 |
76.30% |
|
30. Edward Jones Dome (Rams) |
396925 |
56703 |
76.30% |
|
31. Raymond James Stadium (Buccaneers) |
440819 |
55102 |
83.90% |
|
32. O.co Coliseum (Raiders)
|
433732 |
54216 |
86.00% |
An astonishing ten teams finished the season having sold out every home game. The Dallas Cowboys operated at an attendance capacity of a whopping 110% and as usual were first in attendance. They were able to reach that number with all of the 'Party Pass' tickets offered at AT&T Stadium. These are the standing room only tickets for fans. The NFC East as a conference also boasted strong attendances with three of it's four teams in the top five.
What's intriguing is how the Pittsburgh Steelers are always at the bottom of the league's attendance lists yet boast by far one of the league's most popular franchises. Those numbers should change in coming years when they add some 4,000 additional seats to Heinz Field.
The largest jump in attendance in 2012 were the Cincinnati Bengals and Paul Brown Stadium. The team finished dead last in attendance in 2011 with less than 400,000 fans attending a Cincinnati Bengals game. In 2012, they climbed eight spots with nearly 490,000 Bengals fans turning out for games. The largest drop in attendance happened in Kansas City who finished 8th in NFL attendance in 2011 but 16th in NFL attendance in 2012. Arrowhead Stadium has always been one of the more frequented stadiums with it's passionate fan base and lively tailgate scene.
For the second straight year, the Tampa Buccaneers, St. Louis Rams, Oakland Raiders and Miami Dolphins all finished in the bottom five on the NFL attendance list. This is simply because of the lack of competitiveness of those teams.
Related Articles
- 2013 NFL Attendance Recap
- 2014 NFL Team Salaries and Payroll
- 2013 NFL Team Salaries and Payroll
- 2012 NFL Attendance Recap
- NFL Stadiums - Construction Cost Rankings
- Top Ten Largest NFL Stadiums

